

A founder I spoke with last year spent $40,000 on an AI chatbot. Six months later, nobody on his team could explain its value. The tool worked fine. The problem was that nobody had measured anything before turning it on. So there was no way to prove whether it helped. That gap is exactly why learning How to Calculate ROI on AI Automation Projects matters more than picking the right vendor. This guide walks through the formula, the costs people forget, the benefits they undercount, and the business workflows worth automating first.
The basic ROI formula and how to apply it to AI automation
The ROI formula is simple: ROI (%) = ((Annual Benefits − Annual Costs) / Annual Costs) × 100. The hard part is filling in the numbers honestly. For AI automation ROI, your benefits bucket includes labor savings, error reduction, faster cycles, and revenue the automation makes possible. Your costs include build, licensing, and maintenance. According to Deloitte, a sound ROI calculation methodology ties every number back to a measurable business outcome rather than the technology itself. Research on measuring returns from automation and AI investments reinforces that framing returns around business outcomes, rather than feature counts, is what separates credible ROI claims from hopeful ones.
Estimate it on your own numbers. Before committing a budget to automation, it helps to see the math on a real role. Enter a few figures below to estimate the annual saving, ROI, and payback period — based on your numbers, not ours.
Identifying and quantifying costs (initial, operational, hidden)
Most teams count the license fee and stop. The initial costs go further: discovery, integration with existing systems, data cleanup, and staff training. Then come operational costs like hosting, API usage, and monitoring. The hidden costs are where projects quietly bleed money: change management, the time your team spends adapting, and rework when the first version misses the mark. A McKinsey analysis of automation programs found that underestimating these hidden costs is one of the most common reasons stated payback periods slip. This happens because hidden costs land after the budget is locked, so they get paid out of the return instead of the project line. Build a full cost picture before you compare it to any benefit.
Hard vs. soft (tangible vs. intangible) benefits
- Labor savings are easily quantifiable.
- Cost savings can be directly measured.
- Error reduction impacts financial performance.
- Direct revenue gains are straightforward to present.
- Better visibility into operations is intangible.
- Less founder stress improves overall productivity.
- Improved morale enhances team performance.
- Productivity gains drive long-term returns.
Hard ROI metrics are the numbers you can defend in a finance meeting: labor savings, cost savings, error reduction, and direct revenue gains. These are tangible and easy to put a dollar figure on. Soft ROI metrics cover the intangible benefits: better visibility into operations, less founder stress, improved morale when people stop doing repetitive work. Finance teams discount what they cannot measure. So quantify the hard benefits first and present intangible benefits as supporting evidence. Many assume soft gains are fluff. In reality, productivity gains and reduced burnout often drive the long-term return more than the headline labor savings, because a team that stops firefighting takes on higher-value work the spreadsheet never captured.
Defining goals, KPIs and establishing a baseline
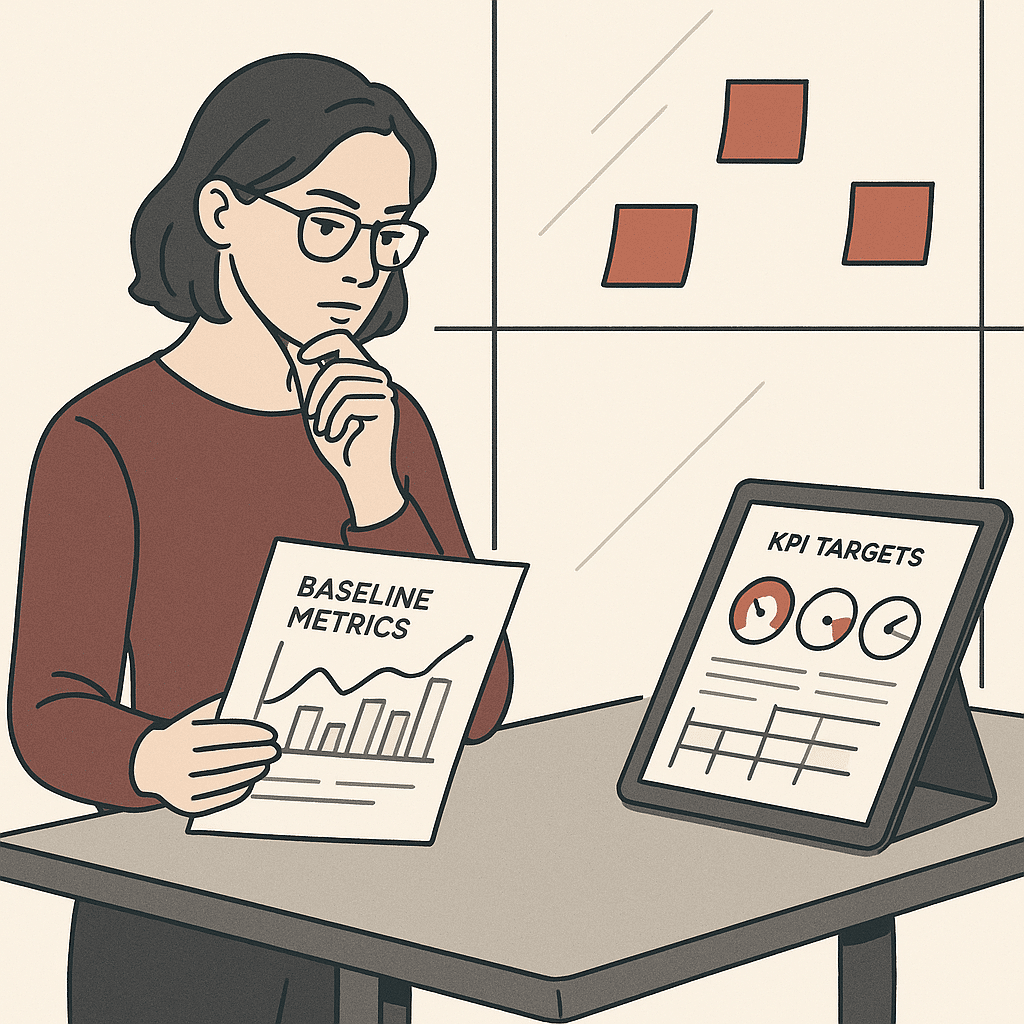
You cannot prove improvement without a baseline. Before automating anything, record how long the manual process takes, how many errors it produces, and what it costs in labor today. Drawing on U.S. Bureau of Labor Statistics data on labor costs and productivity can help you assign credible dollar figures to the manual work you plan to eliminate. Those numbers become your reference point. Then set clear goals tied to specific KPIs: cut processing time by half, drop error rates below 1%, free up 15 hours a week. The key metrics you choose should map directly to a business outcome, not to how busy the AI systems look. Running an honest readiness check on your operations before you build is one way to make sure your baseline reflects reality. A baseline measured for two weeks beats a guess every time.
Key metrics to track (time savings, cost savings, error reduction, productivity)
Four metrics carry most of the weight. Time savings: hours reclaimed per week from manual processes. Cost savings: the pre- versus post-automation difference in labor and operational costs. Error reduction: defects or rework eliminated, which often hides large downstream costs. Productivity gains: throughput per person or per process. Tie a dollar value to each. If a workflow automation effort removes 40% of an $80K role’s workload, that is a $32,000 annual saving. Tracking these consistently turns vague “it feels faster” claims into hard ROI metrics you can put in front of leadership.
Common mistakes when calculating AI ROI
- Measure business outcomes, not just tool usage.
- Establish a baseline for honest comparisons.
- Subtract maintenance costs from labor savings.
- Account for hidden costs in calculations.
- Ensure reported ROI withstands finance audits.
The most common ROI mistakes share one root cause: measuring the tool instead of the business outcome. Teams celebrate “10,000 tasks automated” while the actual operational efficiency barely moves. Others skip the baseline, so they have no honest before-and-after to compare. Some count gross labor savings without subtracting maintenance and operational costs, which inflates the return. And many ignore hidden costs entirely. What actually happens is the reported ROI on AI automation projects looks great on a slide and falls apart when finance audits it. Measure the workflow, not the technology.
Payback period and timeframe for returns
Payback period is how long until cumulative benefits cover your total investment. For focused SMB projects, that payback period often lands within 3 to 6 months because the automated manual processes were genuinely costly. Enterprises move slower. A 2025 Deloitte survey found most large organizations reach satisfactory return on investment in two to four years, with only 6% seeing payback under a year. McKinsey’s findings on the economic impact of automation show that the difference is scope. Narrow, high-impact business workflows pay back fast. Sprawling, company-wide rollouts spread effort thin and stretch the timeline. A practical guide to AI workflows for small business breaks down how to keep scope tight enough to hit those faster payback windows.
Why AI projects fail to deliver expected ROI
The gap is almost always between the plan and the real problem. Teams automate a process that was never the actual operational bottleneck, then wonder why nothing improved. The IBM Institute for Business Value found enterprise-wide AI initiatives averaged just 5.9% ROI against roughly 10% capital investment. That is a sign effort was spread too thin rather than aimed at a specific business outcome. AI project failure rarely comes from bad technology. It comes from weak problem selection and measuring activity instead of results.
Industry-specific ROI benchmarks and real-world examples
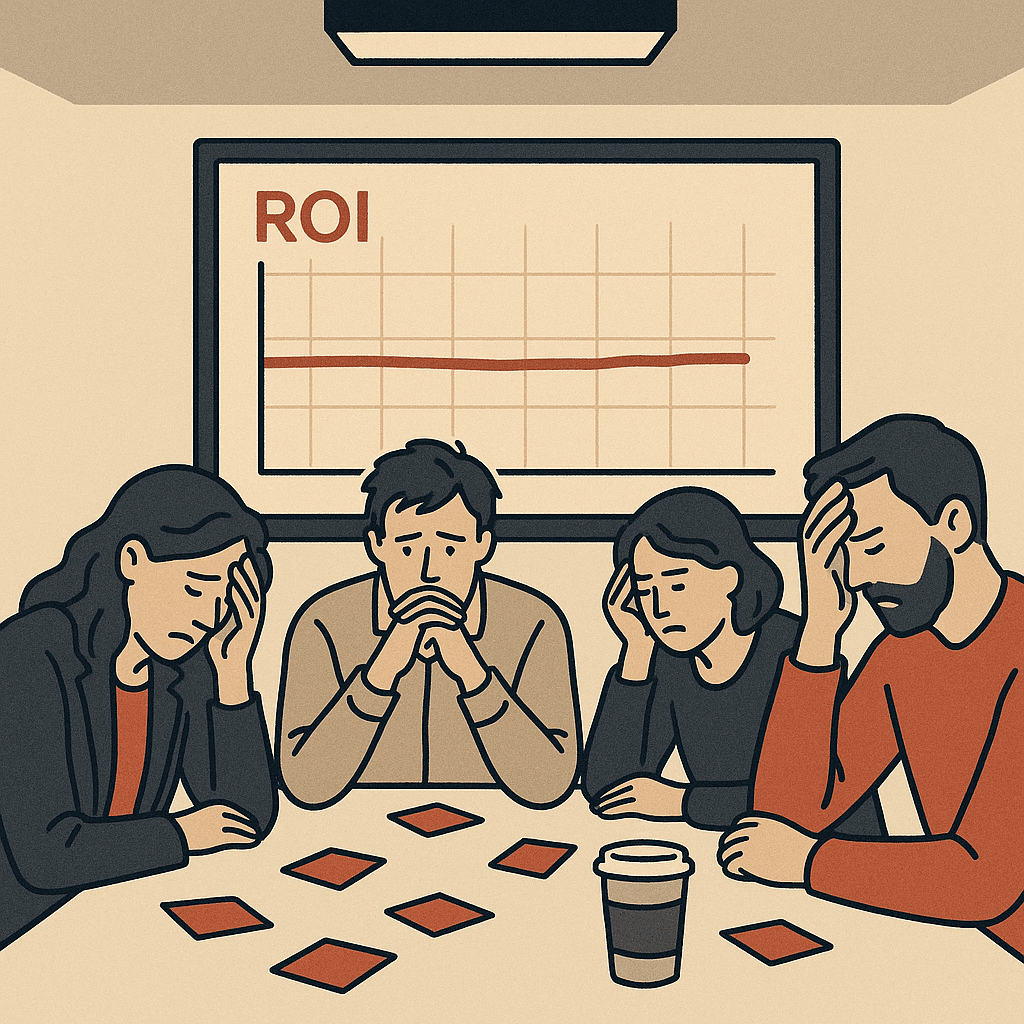
Roi benchmarks vary sharply by sector. SMBs investing $5,000 to $15,000 in targeted workflow automation have reported 150% to 300% return on investment within 12 months. A 2024 Deloitte study found SMBs saved $40,000 to $120,000 annually on labor and efficiency. Deloitte’s analysis of automation adoption and returns provides recognized industry data that helps ground these figures in real-world outcomes rather than vendor promises. Low-margin sectors like retail often need a 3:1 ratio before a project is worth calling a win, while service firms accept lower. As a rule, an AI automation ROI below 2:1 is weak. Compare your projection against the roi benchmarks for your own industry, not a headline number from a different one.
Consider a mid-sized accounting firm we worked with that automated client onboarding before fixing its messy intake forms. The automation ran flawlessly but processed bad data faster, so staff spent the same hours correcting records downstream and the projected 200% return came in closer to 40%. The lesson: a benchmark only holds if the underlying workflow is sound before you automate it.
Mapping before-and-after workflow scenarios
A before-and-after scenario makes ROI tangible. Take a real workflow: an invoice approval that takes three days across four people. Map every step, the time, the handoffs, the errors. That is your “before.” Then model the “after” with automation in place: three days drops to two hours, two people instead of four. This scenario analysis turns abstract promises into a clear comparison your team can challenge. The exercise also exposes which steps the automation genuinely improves and which it leaves untouched. So you are not crediting the AI systems for gains they never delivered.
Building an ROI model or dashboard to track results
A spreadsheet model is fine to start, but an ROI dashboard keeps the numbers honest over time. Pull live data on time savings, cost savings, error reduction, and throughput, then compare against your baseline weekly. An AI automation ROI calculator built into the dashboard lets you update assumptions as real usage data comes in, so projected returns get replaced by measured ones. The point is accountability. When leadership can see operational efficiency improving in near real time, the project stops being a leap of faith and becomes a tracked business outcome.
Calculating ROI for custom-built automation vs. off-the-shelf software
- Lower initial costs for quick setup.
- Requires workflows to adapt to software.
- Annual subscriptions can compound costs.
- May need workarounds for unique needs.
- Higher upfront costs for tailored solutions.
- Longer setup time to fit operations.
- Eliminates recurring license fees.
- Better suited for unique operational bottlenecks.
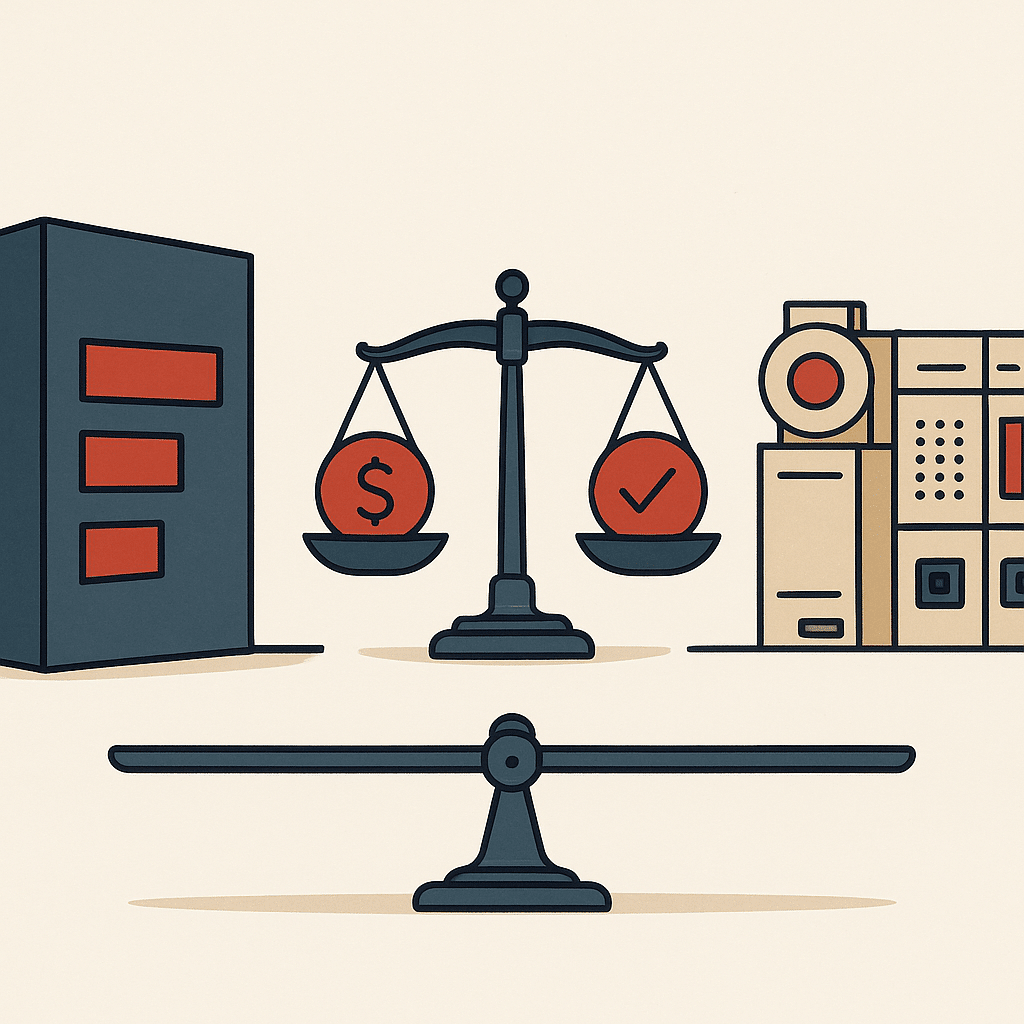
Off-the-shelf software has lower initial costs and faster setup, but it forces your business workflows to bend around its design. Custom-built systems that are built around how you operate cost more upfront and take longer, yet they fit how your team actually works and tend to remove more manual work. To calculate ROI fairly, compare total cost of ownership over three years, not just the first invoice. Off-the-shelf subscriptions compound annually and often need workarounds. Custom-built systems carry maintenance but eliminate the recurring license drag. The reason the three-year window matters is that off-the-shelf workarounds quietly add labor every month, so a cheaper sticker price often loses to a custom build by year two. The right choice depends on how unique your operational bottlenecks are.
Quantifying ROI from reducing founder dependency and operational bottlenecks
Founder dependency is an invisible cost until the founder takes a week off and everything stalls. When too much knowledge and decision-making sits with one person, the business cannot scale and every delay routes back to the same desk. To quantify it, estimate the hours the founder spends on repeatable decisions and approvals each week, then price that time at what it would cost to replace, or at the revenue the founder could generate doing higher-value work instead. Automating those repeatable approvals and handoffs removes the bottleneck and frees the founder from being a single point of failure. This is where custom-built systems earn their keep: off-the-shelf tools rarely map to the specific decisions a founder-led business has quietly centralized over years.
Putting this together, knowing How to Calculate ROI on AI Automation Projects is less about the formula and more about the discipline behind it: set a baseline, target a real operational bottleneck, measure the business outcome, and ignore the vanity metrics. Get those right and the math takes care of itself.
Prioritizing which manual workflows to automate first for fastest ROI
Start where pain and frequency intersect. Map your manual workflows and score each on two factors: how often it runs and how much time or error it creates per cycle. A task done daily that eats two hours beats a complex monthly process every time. Then filter for readiness. Prioritize workflows with structured inputs, clear rules, and stable steps, because these convert to automation quickly with minimal exceptions. Avoid starting with messy, judgment-heavy processes that need redesign first. The goal is early wins that free up real hours, build internal trust, and fund the harder automation work later.
Frequently Asked Questions
How do you calculate ROI on an AI automation project?
Use ROI (%) = ((Annual Benefits − Annual Costs) / Annual Costs) × 100. Annual benefits include labor cost reduction, error reduction, revenue enablement, and cost avoidance, while costs cover implementation, licensing, and maintenance. For example, automating a process that saves 80 hours per week at $35/hour returns about $145,600 in annual labor savings.
What metrics should I track to measure AI automation returns?
Track cost savings (pre- vs. post-automation labor and operational expenses), productivity gains (cycle time and throughput), error reduction, and revenue enabled by faster processes. For instance, cutting 40% of manual workload from an $80K/year role represents a $32K annual saving, and reducing a 3-day cycle to 2 hours can unlock previously inaccessible revenue.
How long does it take to see ROI from AI automation?
Timelines depend on complexity and company size. Small and mid-sized businesses often reach positive ROI within 3 to 6 months, while a 2025 Deloitte survey found most enterprises hit satisfactory ROI in two to four years, with only 6% seeing payback under a year.
Is investing in AI automation actually worth the cost?
It depends on whether you target a real operational bottleneck rather than buying software for its own sake. SMBs investing $5,000-$15,000 have reported 150%-300% ROI within 12 months, and a 2024 Deloitte study found SMBs saved $40,000-$120,000 annually on labor and efficiency. Returns hinge on implementation quality and choosing the right process to automate.
What if our AI project barely breaks even? Is a low ROI still acceptable?
Generally an ROI below 2:1 is considered poor, since the return barely covers the investment. Acceptable thresholds vary by sector:a low-margin field like retail may treat anything under 3:1 as unfavorable. The IBM Institute for Business Value also found enterprise-wide AI initiatives averaged just 5.9% ROI against 10% capital investment, so scope matters.
How does AI automation compare to keeping a process manual?
Manual processes carry ongoing labor costs and higher error rates, while AI automation requires upfront investment but can cut operational costs by 20-28% and drop error rates below 1%. Tasks that take hours or days manually can complete in minutes, which is where most of the throughput gains come from.
What does a 1000% return on $1,000 look like?
A 1000% ROI on a $1,000 investment means a $10,000 net gain, returning $11,000 total. In automation terms, that would mean a $1,000 spend on a tool or workflow generating $10,000 in measurable annual savings or new revenue beyond its cost.
Why do so many AI projects fail to deliver measurable ROI?
Most failures come from a gap between ambitious planning and the actual problem being solved:automating the wrong process or measuring at the tool level instead of the business outcome. The IBM Institute for Business Value found enterprise AI returned only 5.9% despite heavy investment, signaling effort spread too thin rather than focused on a specific bottleneck.